BankNifty dodges again. Now looks targeting 61.8% retrcement near 16850.
My current count on BankNifty is in the chart.

There are a few other Alternate counts but this seems to be the most probable.
Also as per time target, discussed in NIFTY post, this week we enter week of 38% time taken for retracement for wave IV. Few weeks of grace should meet our both the targets.
2nd April
Not the way I had expected but BANKNIFTY retraced full 50% of wave III all the way down near 17,700. I had tweeted about this as soon as became clear that wave IV has not completed yet.
Now applying the same wave V (Intermediate degree) estimates of a minimum move of 3227pts we arrive at exactly the previous top just under 21,000. It would be interesting to see what pattern it traces in this wave.

For this count invalidation is below 17,600
NB: Upon request from a good friend I am adding internal wave count of the fresh wave up. Appears a perfect 5 wave impulse move with matching internal 5 wave pattern in perfect fib relationship. At best it moves near 18740 but then wave 2 corrective should follow.

15th Feb
BANKNIFTY completed the corrective wave IV little lower than the expected level of 18340. I had not accounted for this lower target but the move was perfectly till 138% of the sub wave A of wave C !
The current wave V has length of 3227pts from the start of this wave at 18227. That should take it to 21454 !! However if it prefers to go for extensions of the target could be higher. Truncation of wave V would end it at 20222. Extensions look difficult so for now I am working with the targets of 20222 and 21454. Internal wave count is not conclusive as to which is more likely so more monitoring the internal wave would be required.
9th Jan
Finally we are at the level we were looking for for this correction. From here it offers an excellent risk to reward ratio for going long. Initial stop would be below 18300 as the alternate count target mentioned in the last post is near 18340.
6th Feb
BANKNIFTY seems to be targeting the lower support level near 18,400 as was feared in the last post.
Here in the hourly chart I have my preferred and alternate count indicating different wave ending levels. Alternate count is in Grey and its likely target is also in Grey.

3rd Feb
BANKNIFTY completed Wave III near 20,900 and I had tweeted a warning that the wave has ended and it is now in Balloon zone. Within minutes the index started correcting sharply.
Since then the index is in wave IV correction. The target levels for this wave is generally taken near wave 4 of lower degree which is near 18,400. However, the index has not been correcting fully for almost the entire up move due to its very bullish wave count combo. It has ended correction near 23.6% level in most recent cases. That level has reached today. End of the current wave is just below 19,200 but it is too close a call to wait.
Internal micro-wave count, both preferred and alternate, in 15min time frame, is in the chart with comments.

What I am not sure is whether the correction is ending somewhere here or if there is more to come (18,400) and looking at results and wave counts of some PSU stock I suspect there could be more to it. Bounce from here should tell us more.
15th Jan
Rate Cut starts and BANKNIFTY breaks out !
As expected in the last post BANKNIFTY refused to break below 18200 proving my hunch right that it may go for wave 5 extensions. It resumed its journey up from just 23.6% retracement level. Such is the bullish characteristic of this index, a typical wave 3 combo effect.
Apparently the index did not want to stop at 100% for wave 3 completion and it has now broken above that level indicating that it may be looking for 138% target which is close to 19800.
As for immediate next move, wave count on hourly chart suggests a strong resistance near 19500.

6th Jan
Ahh, so BANKNIFTY finally reacts to wave 5 of 5 discussed in last two posts. It chooses its own level, 23pt below my estimate of 19188, but well within the range specified in the earlier post.
That is then the end of wave 3 and we are now running wave 4 correction. The wave 4 corrections are best estimated to end near wave 4 of lower degree or at fibonacci retracement of 38.2% of wave 3 and these levels are 17625 or below.
Please remember the index is in a wave 3 of 3 at higher degree and its not end of the world yet. I would watch 18200 very carefully for this reason.
This index being the main driver for the mother index I am more keen on watching this than the mother index to get fair idea of what to expect over next few weeks.
2nd Jan
Christmas post playing out. Here is my count and why I expect some turbulence around 19200. Though I am not quite sure of the internals which indicate 19188 levels. The least I would do is keep my stops tighter around that level.

25th Dec
Wave 5 of 5 should start soon. Minimum length of this entire wave from 17.5k level is upto 19150/200 area.

17th Dec
Strong reversal from a key level of 38.2% of previous wave and then a follow up gap up candle. Huge volume candle yesterday was quite indicative. Explains how bullish this index is. And it is now supported by Yellen's express admission of cheap money for 6 more months.
Appears to be heading for wave V. Though the wave III seemed to never end (overshoot of target by a good margin) it finally turned around in consonance with parent index.

12th Oct
Updated hourly chart with wave counts.
17760/17870 likely target.

28th OCT
BANKNIFTY, the main driving force behind NIFTY, is now nearing a strong resistance at 16730 if we consider this entire move from 14340 as 5 wave triangle move and we are in the final wave "e" now.
However the internal counts suggest there may be more to come and the immediate next levels to consider is 16900. Hopefully the internal counts are honored and the move continues (in recent past it has ignored the internal count).
Daily chart

9th OCT
BANKNIFTY is in Wave IV corrective phase and from the moves so far it appears it has completed one leg of the move as the move down was a distinct 5 wave impulse (Wave A) indicating that a follow up wave down (Wave C) should be expected after a swing up (Wave B).
The swing up started yesterday and continued today. Generally this swing is in a zigzag pattern so a small move down followed by a wave on the up can be expected. Let us monitor the moves tomorrow and Monday for more confirmations.
Hourly chart

29th Jul
Appears to have completed 5 wave move down and I would consider this only first leg or wave 'a' of correction. Therefore a corrective move up to make wave 'b' should be forthcoming. My expectations of further moves are in the chart.
Hourly Chart
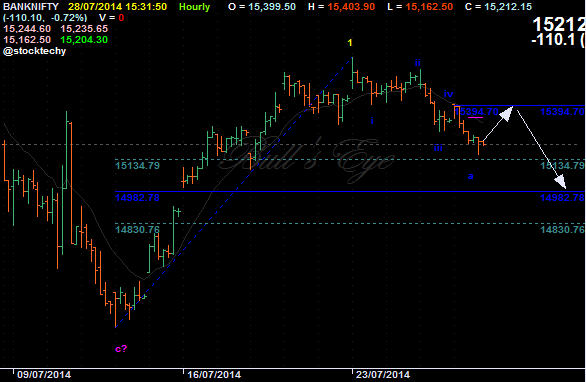
Shorts may be initiated at the target area with stop above 15,560 .
@askchirag #BN Extly Bullish. Likely W5 initiated for 17450 which is 168%of W I but not likely to stop. pic.twitter.com/VL6Yk588k0
— EWite (@Stocktechy) July 20, 2014
@askchirag #BN W 1 & W 3 are equal so certainty that W 5 will Extend to 261% of W I higher degree at 23k !!!
— EWite (@Stocktechy) July 20, 2014
25th June
As expected BANKNIFTY did make move on the up and it was more than the targets set out in the earlier post. It is making a 5 wave move and has completed it with minimum requirement of move of sub wave 5 to 61.8% of sub wave 1. Ideally the sub wave 5 target should be around 15412 and it remains to be seen if it completes that tomorrow or starts to move down.
I am considering this entire up move of 5 sub waves from 14945 as wave C of corrective Wave B of higher degree. And on completion of this 5 wave move we should see a good wave C down move to correction target of below 14500. Tomorrow or day after it should set the tone for the down move.
But any move up from correction of the 5 wave would mean we are done with correction in BANKNIFTY (unlikely as no appreciable buying is seen in the sector).
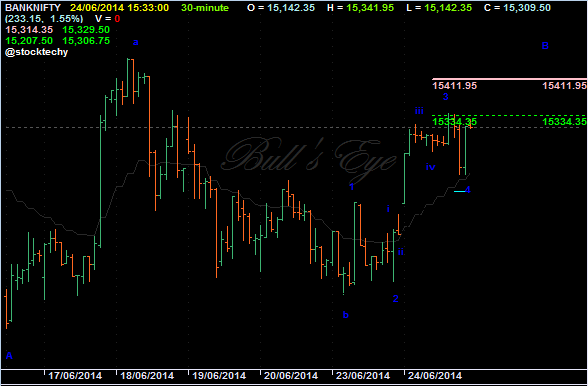
NB : For an ABC count generally C=A is taken as standard target. That level in this case is at 15535 and it must be kept in sight for any shorting. In other words 15550 must be kept as stop for any shorts.
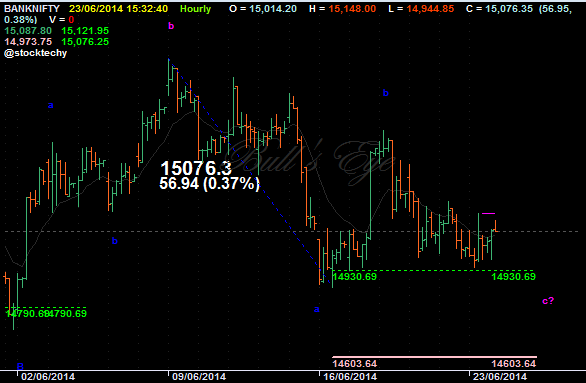
24th June
BANKNIFTY refused to budge from 61.8% level of previous sub wave 'a' while NIFTY went ahead with the correction of ABC full count.
This would mean that either it wants to go higher (correction in correction) to
15200/15265
and then go for a sharp final dash down to
14600/14450
OR
may be it is done with correction(unlikely). If the first option is true we still have few days of correction left.
Shorts at higher level with minimum stops can be quite profitable as there is quite a distance to the target zone.
13th June
BANKNIFTY is not revealing the real intentions ahead of IIP and inflation data.
I have both the counts ie Bullish and Bearish but there is no confirmation yet on either side.
I have included my conclusion in the chart.
Hourly chart

Week of 2nd June
Correction likely to continue till 14,300.
Buy around the target area for a good upside.
Hourly Chart

Week of 24th May
Outlook still looks quite bullish. And final dash to destination near 16,200 appears to be a 5 wave channel or ED.
It is said targets of some counts are only abstract, so is the case with this Index and I have been consistently proven wrong on the final target! Will the index beat the target this time too?
Hourly

21st Apr
View remains the same as the earlier post of 7th Apr, but a near term outlook on Daily chart.
Daily

7th Apr
Are we likely to see extension of W5 in BANKNIFTY?
Most likely, Yes.
With such a set up (see chart), expect it to move to AP middle median line and then to final destination around 13600/13800. This is my conservative count and will watch this correction to confirm above.
Weekly

27th Mar
Completes a 5 wave impulse.
Unless there is extension (Unlikely) it should now go for a good correction.
Any move above YDH triggers 13100 else down.

14th Mar
#BANKNIFTY Keep an eye for today's High. Break above that triggers 12634 pic.twitter.com/6f4rxuzi9R
— EWite (@Stocktechy) March 13, 2014

13th Mar
Either the price comes to Moving Averages or the Moving Averages come to price.
Failed Breakout a clear negative.
Unable to clinch 78.6% retracement proves Bears' presence.

11th Mar

#BN Do U think this is possible today? pic.twitter.com/rOcJE8tReU
— EWite (@Stocktechy) March 10, 2014
UPDATE
10th Mar

UPDATE
6th Mar
There seems to be end of the road for BANKNIFTY.
BANKNIFTY today completed minimum requirement of a 5 Wave impulse up-move. Now it should go for some correction or consolidation unless it decides to touch higher level as shown in the chart. Keep an eye for break of YH for upmove else some divergence or bearish candle ahead for confirmation.

UPDATE
5th Mar

Convergence of Moving Averages.
Some consolidation ahead.


No comments:
Post a Comment